Practical service analysis cases such as sales, order, and web log analysis
Understand key metrics for analysis such as RFM, DAU/MAU, churn rate, retention rate, and conversion funnel, and implement them in SQL.
Utilization and practical application techniques of Join, Group by, and Window functions
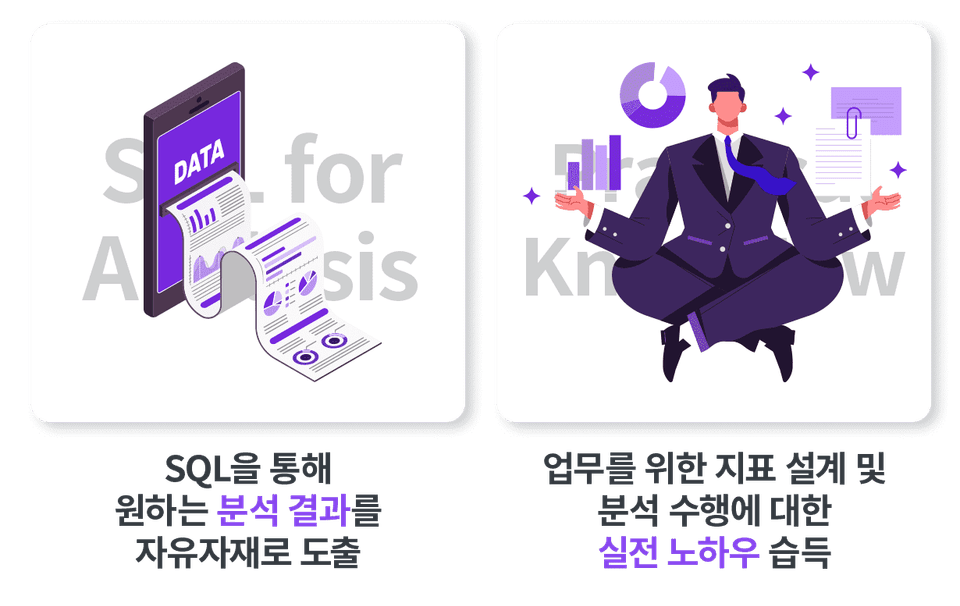
Ability to freely derive desired analysis results through SQL
Strengthening core SQL data analysis capabilities based on practical data similar to actual work
Chart visualization of analysis data
Learn SQL with practical data analysis! You can become a leading data expert 🏃♂️
SQL skills + practical analysis skills all at once!
The demand for data professionals with both excellent SQL skills and the ability to understand company business and services is increasing day by day. Therefore, it is very important for data analysts, data scientists, analysis developers, and data engineers to have excellent SQL skills and the ability to derive analysis results that can improve products and services and to support them.
The lecture 'SQL Data Analysis through Various Cases' is ✅
SQL skills should be developed by solving difficult problems in real life. However, the SQL I have encountered in lectures and books so far is very different from the SQL used in real life.
This lecture is filled with theory and practice lectures using SQL queries used in real-world analysis that you can't find in existing lectures or books. In addition, it is structured so that you can improve your analysis skills and SQL skills at the same time by implementing various analysis indicators used in Google Analytics and growth hacking fields, as well as domain-related contents such as sales analysis and order analysis, through difficult SQL.
After taking this course you will 📜
After completing this course, which implements many analytical indicators used in actual work using SQL, you will become a SQL expert who can freely derive the desired analysis results.
In addition, the various analysis cases learned through this lecture will help you understand how to design indicators and perform analysis to grow your business and services.
If you have practical SQL experience but have not taken the Data Analysis SQL Fundamentals course, be sure to review the course curriculum and watch the ' Course Introduction ' video in Section 0 and the ' Course Selection Guide for Those Who Have Not Taken Data Analysis SQL Fundamentals ' video. Please make sure that the course is suitable for your ability level before deciding to take the course.
We would like to inform you in advance that you may have difficulty understanding the contents of this lecture if you have not taken ' Data Analysis SQL Fundamentals '.
Features of this course ✨
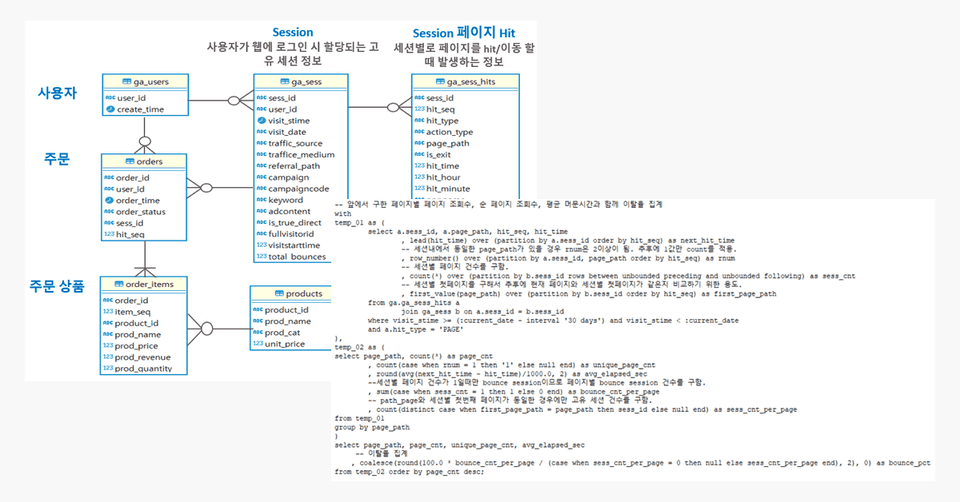
Description of different types of key analytics indicators + Hands-on training to implement analytical metrics with SQL queries
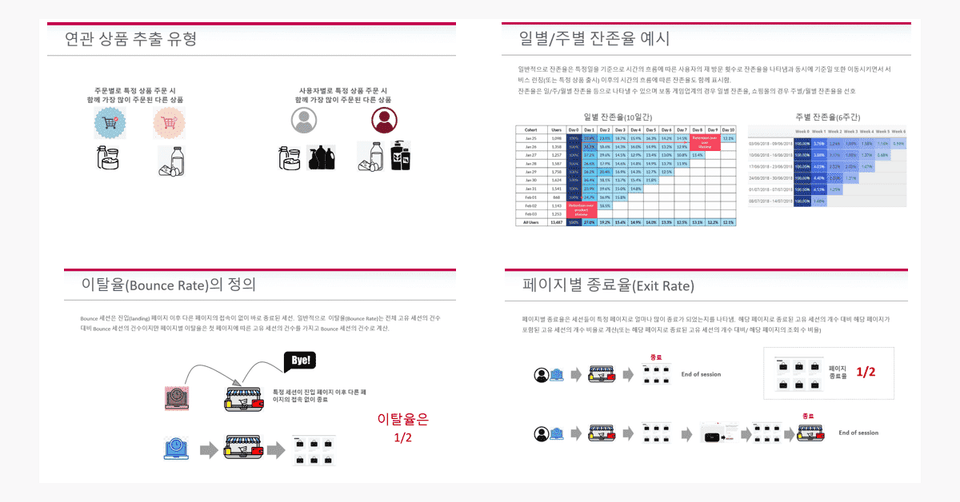
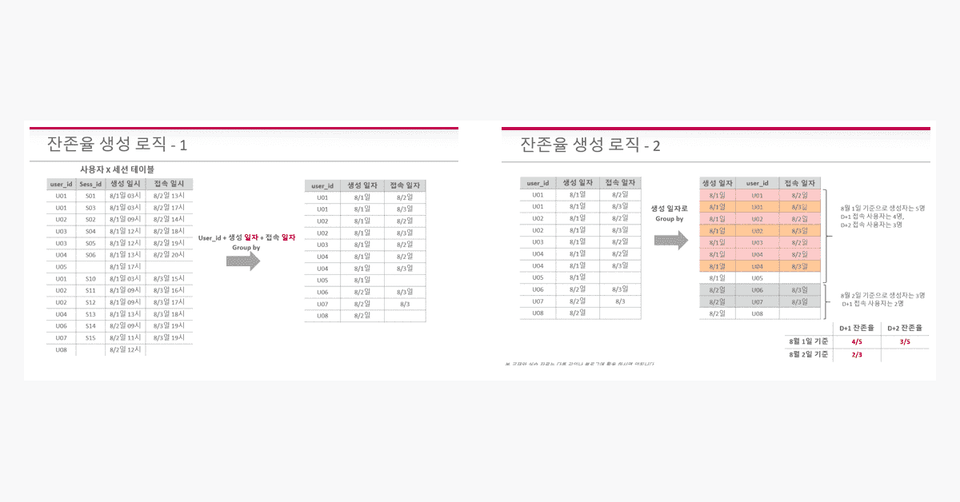
We will explain in detail the key indicators for various types of sales analysis, cross-selling, order analysis such as RFM used in the industry, as well as DAU/WAU/MAU, stickiness, channel analysis, entry page/exit page analysis, bounce rate, retention rate, and conversion funnel analysis that are well utilized in the Google Analytics and growth hacking field.
Challenging SQL exercises based on real-world datasets: We will help you improve your SQL skills to the max!
We will implement difficult SQL on a Google Analytics data set for practice, not toy data. Most of the practical classes are structured as live coding to actively improve implementation skills. After learning, you will become a SQL expert who can freely derive the desired analysis results.
Detailed and thorough explanation of complex logic.
In order to make it easy to understand difficult and long SQL queries, we will explain each processing logic one by one with detailed pictures and diagrams. Through this lecture, you will be able to gradually understand and apply even the most complex SQL.
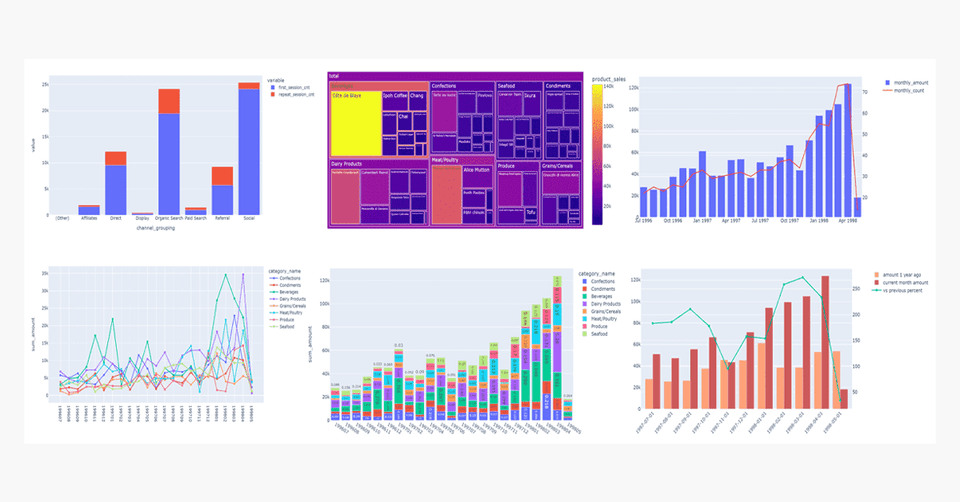
Practice implementing chart visualizations to help intuitive understanding
You can visualize the analyzed SQL results as charts to intuitively understand the analysis results. You can also learn which charts to visualize the analysis results with to convey the results more efficiently. (The visualization code is implemented using Python's Plotly.)
Practice environment Check it out 💻
PostgreSQL is used as the practice environment DBMS and DBeaver is used as the SQL editor.
PostgreSQL is an open source DBMS that is provided free of charge and has stability, performance, and, above all, rich SQL support functions. It satisfies the Ansi SQL standard and has various SQL functions and analytical functions, so it is widely used not only online but also as an analytical DBMS.
DBeaver Community Edition is free, but it has better features, faster performance, and stability than most commercial SQL Editors. DBeaver supports various DBMSs such as PostgreSQL, MySQL, and Oracle.
Additionally, I use Jupyter Notebook and Plotly for chart visualization.
The training environment was created based on a Windows environment, but it can also be performed without any problems in a Mac environment.
📢 Instructions for downloading lecture materials
The lecture materials (PDF), practice SQL code, and data can be downloaded from the [Lecture Materials and Practice Data and Practice Materials] class in Section 0: Introduction to the Lecture and Setting Up the Practice Environment.
Recommended for these people!
Who is this course right for?
People who perform analysis tasks using SQL
Those who want to experience various practical data analysis cases
Anyone who wants to greatly improve their SQL skills
Data Scientists and Data Analysts Leveraging SQL
Data engineers who need to perform data processing/extraction/refinement based on SQL to create tables for analysis or marts
Need to know before starting?
Data Analysis SQL Fundamentals lecture understanding required
I can definitely say that this is one of the best SQL data analysis lectures.
I highly recommend this to those who have learned basic SQL grammar but want to improve their vague SQL skills through various practical cases.
Thanks to the instructor's excellent teaching skills and very informative lecture content, I feel like I have newly discovered SQL, and if you listen to the lecture and practice consistently, your skills will definitely improve. This is a high-quality lecture.
It was also doubly good because he kindly answered my questions during the lecture. I really recommend it. Thank you.
Last year around this time, I was hired as a new data engineer and
I bought both the instructor's SQL Foundation and Data Analysis lectures at the same time with the determination to watch them both.
'I don't have talent in this field.. I understand when I watch the lectures.. but why can't I get the feel for it when I actually work?' I started the instructor's SQL data analysis lecture yesterday after a year of going back and forth and reviewing only SQL Foundation.
Moving averages and weighted averages... It's not easy for a beginner like me. ㅎㅎ
I'm so glad it's unlimited..ㅎㅎ
I haven't seen other data analysis SQL lectures, but I believe this lecture will be the easiest to explain,
so I'll slowly and steadily finish it.
If I had one wish,
I'm unfamiliar with business accounting, statistics, such as sales, so it's too difficult to accumulate data by ETL in the direction that a BI analyst wants. ㅎㅎ
I would be so happy if accounting, statistics, engineering mathematics, etc. came out at the level of SQL Foundation that anyone can see.
Thank you so much for providing such a high-quality lecture at a low price. I'll always cheer you on!
Oh, thank you so much for the long course review. If you continue to follow the exercises in this lecture repeatedly, you will be able to become a recognized SQL analysis expert anywhere.
This is a great SQL lecture with lots of practical examples. I always had a hard time improving my skills because I didn't have any practical analysis experience, but this lecture was a great help.


![[개정판] 딥러닝 컴퓨터 비전 완벽 가이드Course Thumbnail](https://cdn.inflearn.com/public/courses/325035/cover/f4bbef4d-d9a9-4def-a3a5-738a9eed8245/325035-eng.jpg?w=420)
![[개정판] 파이썬 머신러닝 완벽 가이드Course Thumbnail](https://cdn.inflearn.com/public/courses/324238/cover/7e380aa0-48ba-4ee7-a6b2-8da7900568d6/324238-eng.png?w=420)


![[C#과 유니티로 만드는 MMORPG 게임 개발 시리즈] Part5: 데이터베이스Course Thumbnail](https://cdn.inflearn.com/public/courses/325283/course_cover/afb413e6-681e-47cd-808a-099c79fed112/rookiss-rpg-5.jpg?w=420)

![[2025] SQLD 문제가 어려운 당신을 위한 노랭이 176 문제 풀이Course Thumbnail](https://cdn.inflearn.com/public/files/courses/336270/cover/01jr03fxecqc2z7spwsjxhpc80?w=420)
.png?w=420)