파이썬 무료 강의 (기본편) - 6시간 뒤면 나도 개발자
나도코딩
6시간. 여러분이 파이썬 개발자가 되는데 필요한 시간입니다. 핵심 내용만 선정 / 챕터마다 퀴즈 & 해설 / 실생활 기반 예제로 아주 쉽게 설명합니다. 그리고 완전 무료입니다.
Beginner
Python
It's finally here. The world's easiest machine learning course. It's free, so why hesitate? Just keep pressing the 'Learn' button.

How to use scikit-learn, an essential package for Python machine learning
Major machine learning algorithms for supervised and unsupervised learning
How to make Netflix? Movie recommendation system project
Text analysis is a bonus!
With Python Machine Learning
Create a movie recommendation system! 🎞️

Machine learning, you've heard of it at least once, right? Machine learning is a field of artificial intelligence, and in Korean it's called machine learning . When you give it good quality data, it learns from the data on its own and creates something called a model . Using this model, when a new input value comes in, it predicts the output value, so you can think of it as creating a function directly.
 By the way, this is not it :)
You can never visit a large amusement park in one day, but once you visit, you will have a big picture of what the park looks like, where the rides are, and what to ride first the next time you visit.
I would like you to study my lectures like this, like visiting an amusement park for the first time. It is difficult to know everything about machine learning, but you can get a sense of what machine learning is, what you need to consider for learning, and what you need to study more. Then, you can go one step further and gain deeper knowledge through various materials. Let's get started together.
Here are some points sprinkled throughout.
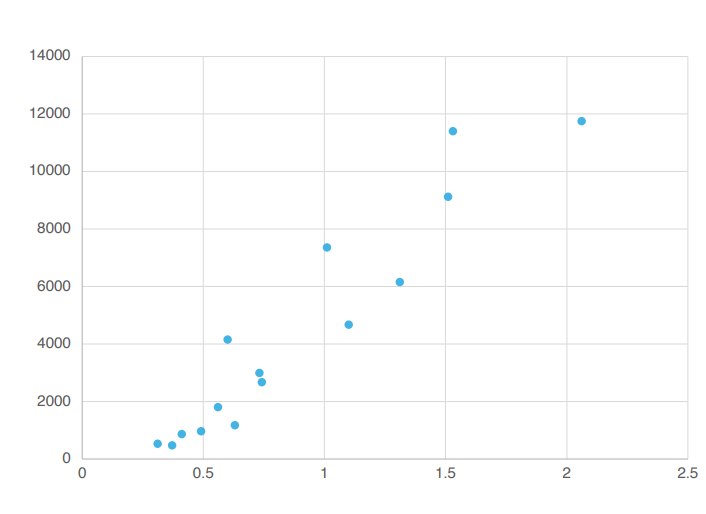
If you were to find just one straight line that best represents these points, what would it be?
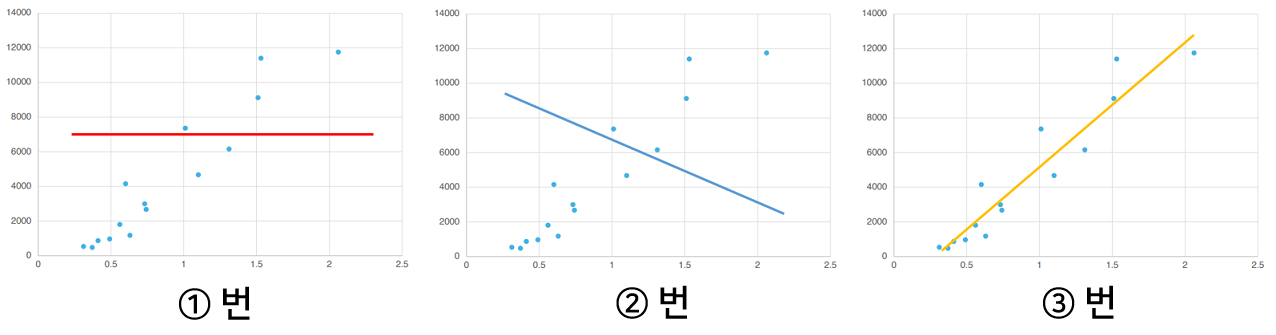
Yes! It's number 3. Why did you think that? Yes. You can tell just by looking at it, right?
We have just experienced the process of a machine learning to build a model on its own. Once this model (in this case a straight line) is built, it can now make predictions .
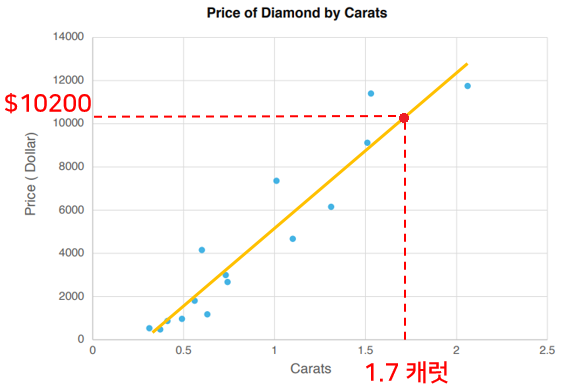
If this graph is diamond price data by carat, and the x-axis is carat and the y-axis is price, you can roughly estimate how much a new 1.7-carat diamond will cost. Predicting using continuous numeric data like this is called a regression model .
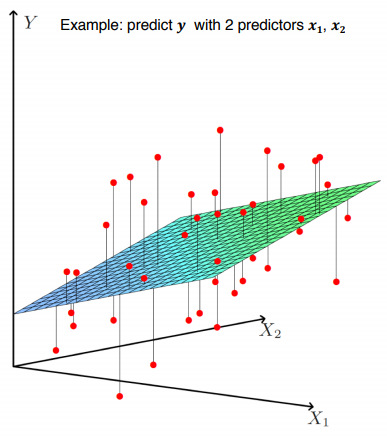
Regression models can sometimes become more complicated. For example, if you are trying to predict test scores based on study time, the study time is not necessarily the only factor that affects the score, right? The factors that affect the test score are called independent variables , and the result is called the dependent variable . And as the number of independent variables increases, a more complex form of multiple linear regression model is required. You can think of the graph as becoming more complicated as the dimensions increase.
In the hot summer, it is scary to use the air conditioner for a long time. Since there is a progressive rate for household electricity, if you use it a little, the electricity bill will jump and eventually exceed hundreds of thousands of won. In cases where y changes rapidly according to changes in x, such as data that increases drastically according to the progressive rate, it is somewhat difficult to express it with just a single straight line. In this case, you can use a polynomial regression model.
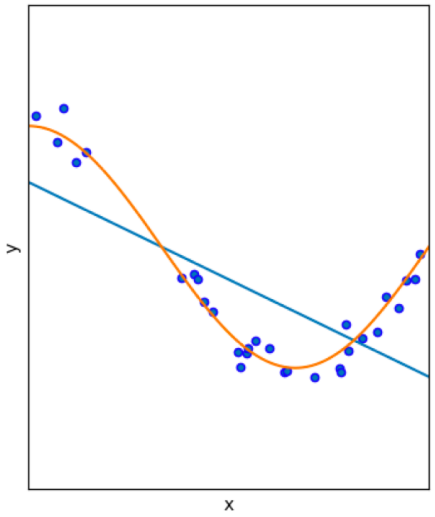
When you have two models to represent the data of the blue dots, the orange curve is much better than the straight blue one!
But when you create these prediction models, how can you be sure that they really predict well? So after you create a model, you have to evaluate how well the model performs. To do that, you divide the entire data set into two, one for training and one for testing. Usually, you divide it into an 80:20 ratio, train only on the training set, and then verify whether the model is good on the test set. And in some cases, you mix the sets and verify it.
In this process, if the model predicts really well on the training set but makes poor predictions on the test set, this is called overfitting , and if the model predicts poorly even on the training set, this is called underfitting . When creating a model, it is important to avoid overfitting or underfitting.


In addition to continuous data, there is also something called categorical data. This is not regression , but classification . Instead of test scores based on study time, this time it is a certification exam, so you can think of it as being divided into pass/fail . So if there is data that says you failed when you studied for 4 hours and passed when you studied for 6 hours, if you studied for 7 hours, you can divide it into a pass or fail.
In machine learning, a representative classification algorithm is logistic regression . Although the name is regression, it is actually a model used for classification, and classification models adjust the criteria slightly as needed. In other words, even if the model says, "If you study for 4 hours, you will pass," we take a conservative approach and say, "You should study for 6 hours."
The content explained so far corresponds to supervised learning in machine learning, but there is also unsupervised learning in machine learning that does not provide the correct answer. Unsupervised learning is when the machine finds meaningful patterns or structures in the data on its own, and there is something called clustering that groups data that show similar patterns together. Dividing news articles into categories such as science/technology, sports, and health is also an example of clustering.
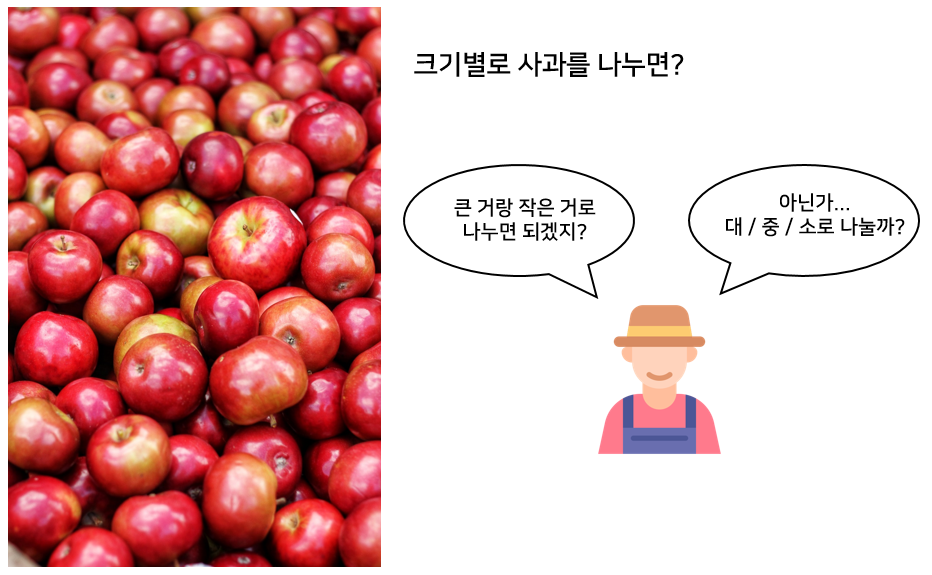
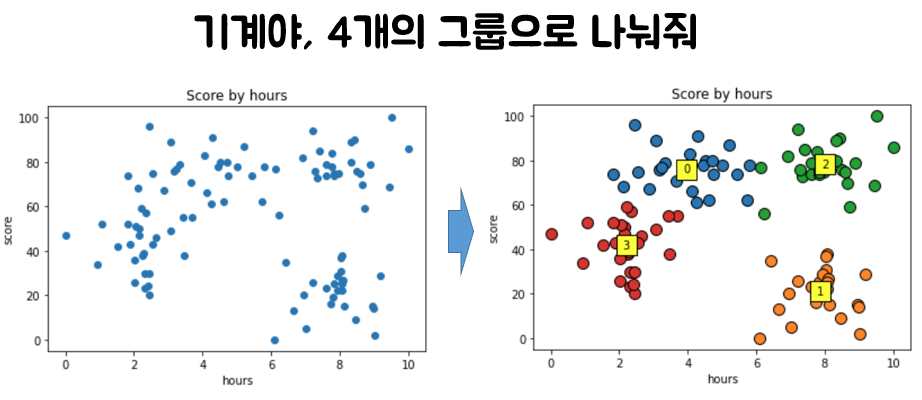
There is a representative algorithm for clustering called K-means . When you first pick apples from an orchard and divide them to sell them as a product, what is the best way to divide them? You can simply divide them into two, large and small, based on size, or into three categories, large/medium/small, or divide them into pretty and ugly, and sell the ugly ones at a lower price.
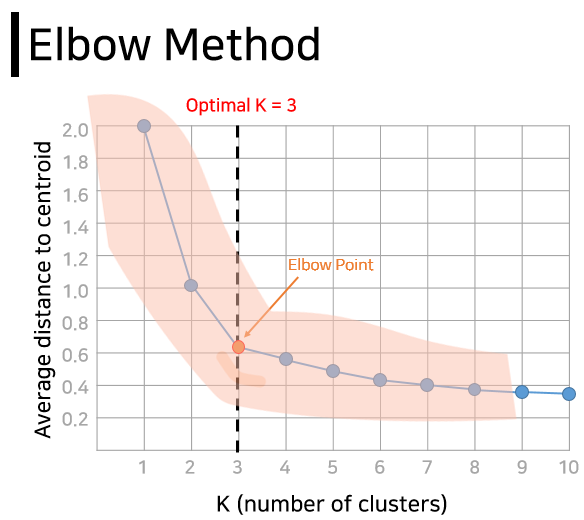
At this time, the number of groups is K. If you are clustering a large amount of complex data, not just apples, it can be difficult to decide on a number . Fortunately, there is a method that can be referred to to find the optimal K. It is called the elbow method because it resembles the shape of an elbow. To put it simply, it calculates the average distance from each data to the center of each cluster (group) according to the change in K, and the point at which the slope on the graph begins to become gentle is considered K.
Once K is determined, we can obtain results divided into K clusters (groups) from randomly scattered data as shown below. If this example is a score based on the time spent studying for a test, we can provide different study strategies to friends in each group.
The basic machine learning contents covered above will be studied through detailed theoretical explanations and practical exercises. After finishing, a quiz will be taken to review what has been learned so far.
In the quiz, you are given only a data set and there are 7 small missions to do with the data. If you have studied the basics well, you can easily digest it. And being able to solve the quiz yourself means that you can do data separation, learning through the training set, data visualization, evaluation, and prediction on your own. Isn't it great? 😃
After solving the quiz, it's time to use it! As with all other application lectures, we will also conduct a project in the machine learning section. The project topic is a movie recommendation system . We will study how to select 10 recommended movies through analysis and learning using a data set of about 5,000 movies. There are several recommendation methods, and we will briefly study the following three.
1. Recommend a movie that many people like
2. Recommend movies that are very similar to a specific movie
3. Customized recommendations based on individual movie tastes
In this process, you will learn a bit about text analysis methods. And since just looking at code is boring, you will create a movie recommendation system site yourself using a package called streamlit, which allows you to create pretty web pages with just a few lines of code. Here, when you select a movie, it will recommend 10 movies based on information such as the movie's genre, director, and actors, and will show you a poster image in Korean. Sounds good, right?
In particular, the last personalized recommendation based on personal movie tastes uses a package called Surprise, and it can be of great help in establishing strategies for which products to recommend to which customers based on the accumulated sales history data, and which items would sell better if sold as a set.
Images, Videos by pixabay, pexels
: https://www.pixabay.com
: https://www.pexels.com
Designed by freepik, flaticon
: https://www.freepik.com
: https://www.flaticon.com
Who is this course right for?
For those who found machine learning difficult
For those who need a really easy and detailed explanation
For those who want to complete their knowledge through practical projects that go beyond theory
Need to know before starting?
Python Basic Grammar
Basic usage of Jupyter Notebook
97,384
Students
2,905
Reviews
910
Answers
4.9
Rating
11
Courses
유튜브에서 코딩 교육 채널을 운영하고 있는 나도코딩입니다.
누구나 쉽고 재미있게 코딩을 공부하실 수 있도록 친절한 설명과 쉬운 예제로 강의합니다.
코딩, 함께 하실래요? 😊
🧡 유튜브 나도코딩
🎁 코딩 자율학습 나도코딩의 파이썬 입문
📚 코딩 자율학습 나도코딩의 C 언어 입문
All
51 lectures ∙ (6hr 41min)
Course Materials:
1. Intro
00:16
7. Linear Regression
05:36
10. Data Set Split
02:09
12. Gradient Descent
06:31
15. One-Hot Encoding
02:04
30. K-means
10:04
31. Elbow Method
02:29
32. Similarity
04:41
33. K-means (Lab #1)
13:41
34. K-means (Lab #2)
06:42
35. K-means (Lab #3)
09:42
37. Quiz
21:37
All
43 reviews
5.0
43 reviews
Reviews 231
∙
Average Rating 5.0
Reviews 1
∙
Average Rating 5.0
Reviews 1
∙
Average Rating 5.0
Reviews 6
∙
Average Rating 4.7
Reviews 13
∙
Average Rating 5.0
Check out other courses by the instructor!
Explore other courses in the same field!
Free


![[PY 0205] 인공지능을 위한 파이썬 레벨4 - 객체와 클래스Course Thumbnail](https://cdn.inflearn.com/public/courses/334425/cover/d595b571-3e0c-4a63-9d5f-f2195736de2b/334425.png?w=420)
![[PY 0204] 인공지능을 위한 파이썬 레벨3 - 함수Course Thumbnail](https://cdn.inflearn.com/public/courses/333279/cover/eb80d90b-0359-4c7d-b9ee-f4997c35171d/333279.png?w=420)

![[PL 0301] 파이썬 가상환경과 아나콘다Course Thumbnail](https://cdn.inflearn.com/public/courses/334755/cover/9d8ca8fb-2031-4dba-aa31-efb43963dba7/334755.png?w=420)