Inflearn Community Q&A
3 asked

그래프에서 과학적 기수법 대신 숫자로 표시하기
Written on
·
475
0
그래프에 과학적 기수법 대신 숫자로 나타내는 방법을 구글링해서 아래와 같이 `plt.ticklabel_format`을 추가하였습니다.
import matplotlib.pyplot as plt
# secondary_y 옵션을 통한 종가와 거래량에 대한 2축 그래프 그리기
stock_daily[["Close", "Volume"]].plot(secondary_y="Volume", figsize=(10, 5))
plt.ticklabel_format(style='plain', axis='y')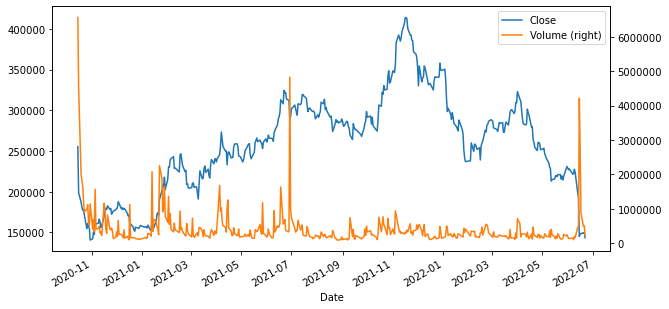
여기서 천단위 마다 콤마(,)를 표시할 수 있는 방법이 있을까요?
감사합니다.
pandas웹-크롤링numpypythonseaborn웹 스크래핑plotlymatplotlib
Answer
This question is waiting for answers
Be the first to answer!